3rd quarter: (extra credit opportunity) These extra credit opportunities are all or nothing credit as students have been notified on January 9th of the due dates.
6 hours of ALEKS due by January 31, 2017 (150 points)
4 hours of ALEKS due by Februrary 17, 2017 (125 points)
4 hours of ALEKS due by March 10, 2017 (125 points)
2nd quarter: (extra credit opportunity)
2 hours on ALEKS due 11/6/16 50 points
1 hour on ALEKS due 11/13/16 30 points
2 hours on ALEKS due 11/20/16 50 points
1 hours on ALEKS due 11/27/16 30 points
4th Quarter presentation:
Due and presented on 5/5/16
Next presentation: Using Statistics in Graphs
1. What is statistics?
a. How do we collect data for graphs?
2. Histograms: explain how to create them
a. What do they show or represent?
b. Include practice problems
3. Box and Whisker Plots: explain how to create them
a. What do they represent?
b. Provide data to create box and whisker plot
Due 4/22/16
You will present your group work to the class on mean, median mode and range(also know as Measures of central tendency) and misleading graphs.
1. Define each word.
2. Give one or 2 examples of the use of the word.
3. Prepare a brief activity
4. Have at least one misleading graph and be prepared to discuss why it is misleading.
You may incorporate music, cartoons or record a skit to purvey the objective of your presentation.
3rd Quarter Project:
Due Date: February 29, 2016
Date issued: February 18, 2016
Project: Rates and Unit Rates (see attachment and rubric below)
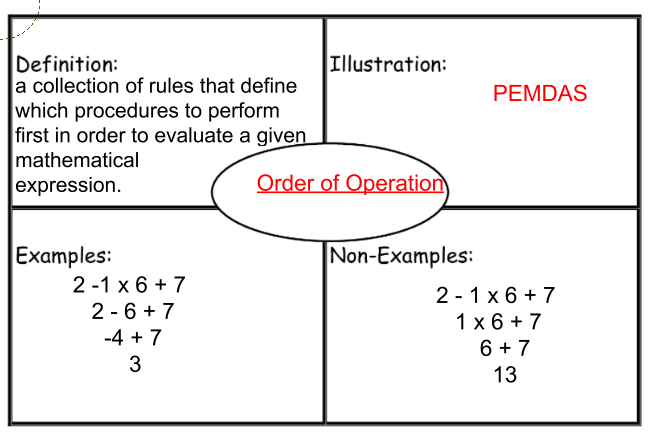
2nd quarter Project Due December 4, 2015. Template is below. Example found below as well. Create a frayer Model of each vocabulary word for algebra.
Vocab Words: Order of operations, Algebra, Algebraic eXpression, Term, Like Term, Variable, Constant, Commutative Property, Associative Property, Identity Property, and Distributive Property.
2nd quarter Project Due November 16, 2015
|
|
Extra Credit Projects
| passion_for_pastries_pbl.docx (due 10/30/15) |
| rate_and_unit_rate_task_honors_matrix.docx (Due 10/30/15) |
Click to set custom HTML
| vocabulary_poster_rubric.doc |
| vocabulary_poster_rubric_pdf.pdf (due 4/27/16) |
